
What if an automation project’s savings case weakens as soon as finance asks what it costs to implement and operate? Knowing how to calculate savings from automation starts with measured performance, not a vendor projection, then compares verified benefits with the full cost of ownership.
Automation may reduce labour effort, energy use, errors, or downtime. Those benefits are defensible only when you can show what changed, how you measured it, and whether automation contributed to the change. A simple payback estimate can miss engineering, integration, training, software, maintenance, and other ongoing costs.
This guide explains how to establish an auditable baseline, calculate benefits and lifecycle costs in AED, and assess ROI, benefit-cost ratio, and net present value. It also covers how to report improvements that are difficult to value, such as reduced downtime, and which operational data can help validate results after deployment. Connected monitoring, including energy monitoring and sub-metering, can provide useful evidence when the project scope and site data support it.
Key Takeaways
- Learn how to calculate savings from automation with a repeatable method that separates gross benefits, implementation costs, and recurring expenses.
- Distinguish direct savings from indirect and strategic benefits by documenting the evidence, attribution, and confidence behind each claim.
- Turn the business case into a measurement plan with accountable owners, defined data sources, review frequency, and an approval path.
- Identify the operational data and integration capabilities needed to verify outcomes after deployment.
- Assess relevant NET WIZARDS L.L.C offerings as potential components of a measured solution, based on project scope and available site data.
Table of Contents
- How to Calculate Savings from Automation: Define the Baseline First
- Calculate Automation Savings with a Transparent Benefit-and-Cost Formula
- Compare Automation Benefits Without Overstating the Financial Case
- Build a Reliable Automation Savings Measurement Plan
- Connect the Automation Solution to a Defensible Savings Case
How to Calculate Savings from Automation: Define the Baseline First
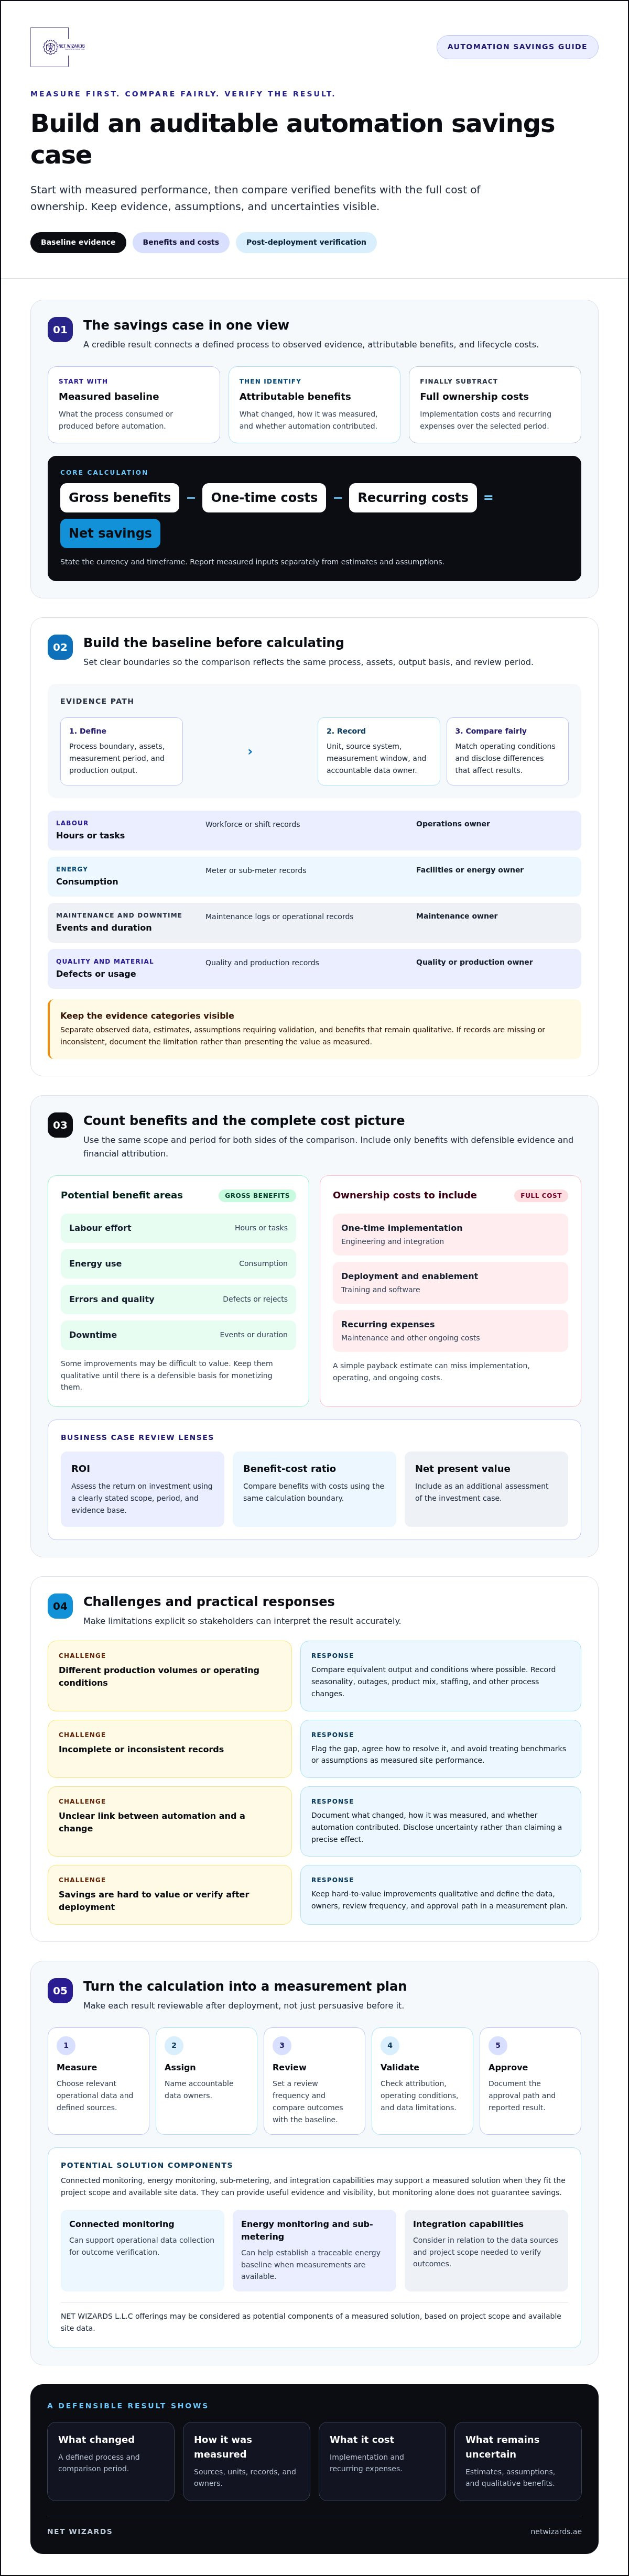
A defensible estimate starts with a clear picture of current operations. Define automation savings as verified costs avoided or value gained, less the relevant costs of achieving that change. Before estimating a benefit, specify the process boundary, assets involved, measurement period, production output, and resources the process currently consumes. Without those controls, a later comparison may confuse changes in demand or operating conditions with automation results.
For how to calculate savings from automation, classify each input before using it: observed data comes from records or measurements, estimates rely on a stated method, assumptions require validation, and benefits that cannot yet be monetized remain qualitative. Keep these categories visible in the business case. A reference on Return on investment (ROI) explains the general investment comparison, but the credibility of an ROI result depends on the quality of its baseline.
Which baseline data should an automation business case use?
Select measures that relate directly to the process under review. Depending on project scope, these may include labour hours, energy consumption, maintenance events, downtime, quality defects, and material use. For each measure, record its unit, source system, measurement window, and accountable data owner. If records are incomplete or inconsistent, flag the gap and agree how to resolve it. Don’t present an industry benchmark as though it were measured site performance.
Baseline evidence map
- Labour: hours or tasks | workforce or shift records | operations owner
- Energy: consumption by process or asset | meter or sub-meter records | facilities or energy owner
- Maintenance and downtime: events and duration | maintenance logs or operational records | maintenance owner
- Quality and material: defects, rejects, or usage | quality and production records | quality or production owner
For every input, retain its unit, period, source, and data owner. If an appropriate system record isn’t available, document the limitation rather than implying that the value was measured.
How do you choose a fair comparison period?
Choose a period that represents normal operation and document what could make it atypical. Compare equivalent production volumes, operating conditions, and process boundaries wherever possible. Note seasonality, planned outages, shifts in product mix, staffing changes, and other process changes. Each can affect resource consumption or output independently of automation.
For example, comparing energy use across periods with different production volumes can be misleading. Record both consumption and corresponding output, then assess whether the comparison is like for like. Apply the same discipline to downtime and quality measures. If conditions differ materially, disclose the difference and treat the result cautiously instead of claiming a precise automation effect.
Connected monitoring and sub-metering can help establish a traceable energy baseline when the required measurements are available and fit the project scope. Monitoring supports visibility, but does not guarantee a saving. A sound baseline makes the later calculation auditable: stakeholders can see what was measured, who owns the evidence, and which uncertainties remain.
Calculate Automation Savings with a Transparent Benefit-and-Cost Formula
Once the baseline is established, use a consistent calculation boundary: the same process, assets, output basis, and review period for benefits and costs. The goal is not to produce a single impressive figure. It is to show how each result was derived and which inputs remain forecasts.
- Fix the scope and period. State which process and assets the calculation covers and the dates or operating period being assessed.
- Identify gross benefits. Sum attributable costs avoided and additional value that can be measured and assigned a defensible financial value.
- Capture project costs. Separate one-time implementation costs from recurring costs over the selected period.
- Calculate net savings. Subtract attributable one-time and recurring costs from gross benefits for that period.
- Report the result and evidence. State the currency, timeframe, data sources, assumptions, and whether each input is measured or projected. Use AED consistently for monetary reporting in the UAE.
Benefit-and-cost flow
- One-time investment: relevant hardware, engineering, integration, installation, commissioning, and training
- Recurring costs: confirmed support, connectivity, software, maintenance, and other operating expenses
- Avoided costs: documented reductions in existing expenditure attributable to the automation
- Measured benefits: verified gains with a defined unit, data source, period, and financial treatment
- Net result: avoided costs plus monetized benefits, less applicable one-time and recurring costs
Which costs belong in the automation calculation?
Include project costs necessary to deliver and operate the solution, where applicable and supported by project information. Use confirmed quotations or internal cost records, and record the period covered by recurring charges. Check budgets carefully: if integration or engineering already sits within another project line, don’t count it again. This prevents double counting while preserving a complete view of ownership.
How should you calculate net savings, ROI, and payback?
Use formulas with explicit boundaries. Let G equal documented gross benefits during the period, I equal one-time implementation cost, and R equal recurring costs during that same period:
- Net savings: G − I − R
- ROI: (G − total costs) ÷ total costs × 100, for the stated period
- Benefit-cost ratio: total benefits ÷ total costs, for the stated period
- Net present value: the sum of each period’s net cash flow discounted to its present value, less the initial investment
- Simple payback: initial investment ÷ periodic net benefit after recurring costs
For net present value, document the discount rate and the periods used. Simple payback assumes a positive, reasonably consistent periodic benefit; variable cash flows require cumulative period-by-period tracking. Label pre-deployment inputs as projections, then replace them with measured results when available. If you’re validating cost categories or data requirements for an industrial connectivity project, discuss the project scope with NET WIZARDS L.L.C.
Compare Automation Benefits Without Overstating the Financial Case
Not every operational improvement becomes a cash saving. A process may use fewer labour hours, yet payroll costs remain unchanged if employees move to other work. Faster production may release capacity without increasing sales. Separate direct benefits with traceable financial effects from indirect improvements and strategic value that still need validation. This distinction is central to how to calculate savings from automation.
For each benefit, record its indicator, source, accountable owner, financial treatment, and confidence. Confidence should reflect the quality of the evidence and how clearly the change can be attributed to automation, not how desirable the outcome appears.
| Benefit | Measurable indicator | Source | Financial treatment | Confidence level |
|---|---|---|---|---|
| Energy use | Consumption for the defined process and output | Meter or sub-meter records | Value only verified consumption reduction using applicable cost records | High when readings and comparison conditions are consistent |
| Maintenance | Recorded work orders, parts, or labour hours | Maintenance records | Count documented avoided expenditure; report released time separately | Medium if attribution or records are incomplete |
| Rework and material | Rejects, rework, or material consumed per output | Quality and production records | Monetize only costs demonstrably avoided | High when process boundaries and output are comparable |
| Downtime and safety | Downtime events, duration, or recorded safety indicators | Operational and safety records | Report measured change; do not assign unsupported monetary value | Low to medium until evidence and attribution are established |
Which automation benefits can be measured directly?
Start with changes that records can demonstrate, such as lower energy consumption, fewer maintenance interventions, reduced rework, or less manual effort per unit. Then distinguish resource reduction from cashable savings. A measured reduction in labour hours is not automatically a payroll saving; it may represent released capacity. Link each result to a process measure and a data owner who can verify how it was captured.
For example, energy monitoring and sub-metering may help compare process consumption when the measurement boundary and site data support it. The readings can strengthen the evidence, but they don’t prove that automation alone caused a change.
How should indirect and uncertain benefits be reported?
Keep operational efficiency, predictive maintenance, energy optimization, and safety benefits visible even when they cannot yet be monetized. State the evidence, uncertainty, and assumptions. Safety improvements matter, but don’t convert them into an invented financial figure. Likewise, projected downtime reductions should remain forecasts until post-deployment records confirm the change and its cause.
Use sensitivity analysis to test the business case under different assumptions, such as lower realized productivity gains or higher recurring costs. Present the resulting range as a scenario, not a promised return. This gives finance and operations a clear view of which benefits drive the decision and what evidence must be collected before those benefits enter the confirmed savings total.
Build a Reliable Automation Savings Measurement Plan
A business case becomes useful only when the site can test it after deployment. Define the measurement workflow before commissioning, including how each metric will be captured, reviewed, and approved. This turns how to calculate savings from automation from a one-time estimate into an evidence process that can distinguish realized changes from assumptions.
How do you verify realized savings after deployment?
Repeat measurements using the original process boundaries, units, and calculation rules. Assign an accountable owner, system of record, collection frequency, and approval path to every metric. Operations can validate production and downtime records, facilities or energy teams can review consumption data, and finance can confirm whether an operational change translated into a recognized cost reduction.
Record changes that may affect results independently of automation, such as output volume, product mix, planned outages, operating schedules, or process changes. Reconcile performance measures with finance-approved cost records before reporting a monetary saving. If data is missing, inconsistent, or affected by a major operating change, flag the limitation and defer or qualify the claim rather than filling the gap with an estimate.
Industrial IoT sensors can provide measurements where existing records do not capture the required operating condition. Gateways and protocol converters may help bring data from relevant equipment or systems into a collection pathway, subject to site compatibility and project scope. Reliable connectivity matters because gaps in transmission can interrupt the evidence trail. For architecture considerations, see the mission-critical industrial networking architecture guide.
What should the savings dashboard communicate?
Keep the display auditable rather than decorative. For each selected metric, show the baseline, current result, variance, data completeness, confidence, owner, and reporting period. Separate measured results from forecasts, assumptions, and benefits that remain unmonetized. Avoid precision beyond what the instrumentation and source records support.
Measurement and approval loop
- Instrument: capture the agreed operational data.
- Validate: check completeness, units, and process boundaries.
- Review: have the metric owner explain variances and operating changes.
- Reconcile: confirm any claimed cost effect against finance records.
- Approve and report: publish the result with its confidence and limitations.
Set the review frequency to match the metric and available records, then document who approves changes to calculation rules. NET WIZARDS L.L.C’s Industrial IoT sensors, gateways, and protocol converters, along with its Industrial-grade IoT Cloud Platform, may support data collection and visibility where they fit the required measurements. These components can contribute evidence, but they do not establish savings without validated site data.
For a project-specific discussion, contact NET WIZARDS L.L.C about measurement requirements for an industrial connectivity project.
Connect the Automation Solution to a Defensible Savings Case
Choose technology only after the business case identifies which measurements are missing and how each metric will be validated. A solution should address a defined evidence gap, such as limited visibility into equipment-level energy consumption or a need to collect data from existing site systems. Its role is to support measurement, not guarantee savings. That distinction keeps how to calculate savings from automation grounded in operational evidence rather than product claims.
Which solution capabilities support savings measurement?
Match each capability to a specific data requirement. Energy monitoring and sub-metering can support a consumption baseline when the measurement boundary, output basis, and available site data are suitable. NET WIZARDS’ AMI Sub-Metering Platform may be relevant where sub-metering aligns with project scope. Industrial IoT sensors can collect selected operational readings, while gateways and protocol converters can support data collection from site systems, subject to confirmed compatibility and integration requirements.
For example, assess whether an M-Bus / Modbus Gateway fits the actual protocols and data sources in scope before including it in the proposed architecture. An Industrial-grade IoT Cloud Platform may provide a pathway for connected data and visibility, while dashboards or analytics can help teams review readings. Neither platform outputs nor dashboard views prove a saving by themselves. Stakeholders still need to verify data quality, compare equivalent operating conditions, establish attribution, and reconcile any financial claim with approved cost records.
Measurement architecture
- Meters or sensors: capture the agreed energy or process measurements.
- Gateways or protocol converters: connect relevant sources where site requirements and compatibility support it.
- Industrial-grade IoT Cloud Platform: provide a potential destination for connected data and operational visibility, subject to project scope.
- Approved metrics: compare validated readings against the baseline and apply finance-approved treatment.
This sequence makes solution selection auditable: each component has a defined relationship to a required data point, and each data point supports a metric that operations and finance can review.
What should stakeholders prepare before project scoping?
Bring the process boundaries, baseline records, target measures, and known data-quality gaps. Document existing meters, sensors, systems, relevant communication or protocol requirements, operating constraints, and calculation assumptions. Identify who owns operational validation and who approves any conversion of measured changes into financial savings. Operations, engineering, and finance should agree on these responsibilities before deployment.
Clear inputs help determine whether Industrial Networking Equipment, Industry 4.0 Solutions, Industrial IoT connectivity, sub-metering, or the Industrial-grade IoT Cloud Platform are relevant. NET WIZARDS’ offering fit depends on project scope and available site data; no category guarantees a particular return.
To discuss your industrial savings measurement requirements, contact NET WIZARDS L.L.C.
Make the Next Automation Decision Evidence-Led
A credible automation business case connects a measured baseline to full implementation and operating costs, then tests expected benefits against verified results. The practical answer to how to calculate savings from automation is to keep assumptions visible, distinguish released capacity from cash savings, and agree on how operations and finance will validate each metric after deployment.
NET WIZARDS has 20 years in business and provides end-to-end solution delivery from sensor design through cloud integration and analytics. Depending on site data and project scope, Industrial IoT connectivity, energy monitoring, sub-metering, and an Industrial-grade IoT Cloud Platform may support the collection and review of operational evidence. These are potential measurement components, not guarantees of savings.
Start with clear process boundaries, available records, integration requirements, and agreed validation responsibilities. That preparation gives stakeholders a stronger basis for deciding what to measure and which solution capabilities fit the requirement. With a transparent method and accountable evidence, your team can assess automation on operational results rather than unsupported projections.
Frequently Asked Questions
How do you calculate savings from automation?
To calculate savings from automation, compare verified benefits against attributable implementation and operating costs over a defined period. Establish a baseline for the process, output, and resource use, then measure the same indicators after deployment under comparable conditions. Count a benefit financially only when records support its value and attribution. Report released capacity or other unmonetized improvements separately so the calculation doesn’t treat them as cash savings.
What costs should be included when calculating automation ROI?
Include relevant one-time costs such as hardware, engineering, integration, installation, commissioning, and training. Add confirmed recurring expenses for support, connectivity, software, maintenance, and other operating requirements within the calculation period. Use actual project quotations or internal cost records where available, and state any estimates separately. Check budget lines for duplication, especially where engineering or integration costs already sit within a broader project or operating budget.
How do you calculate the payback period for an automation project?
For a simple estimate, divide the initial investment by the periodic net benefit after recurring costs. Keep the inputs within the same scope and use a consistent period, such as monthly or annual figures. This method assumes the benefit is positive and reasonably stable. If benefits vary over time, track cumulative net cash flows period by period and identify when they recover the initial investment. Label forecast payback as projected.
Can automation reduce operating costs without reducing headcount?
Yes. Automation may reduce energy use, rework, material consumption, maintenance activity, or manual effort while the workforce remains unchanged. But released labour time is not automatically a cash saving. If employees move to other work, report the gain as released capacity unless it leads to a documented cost reduction or additional value. Distinguish these outcomes in the business case and have operations and finance validate the financial treatment.
How do you measure automation savings when there is no reliable baseline?
Don’t substitute an unsupported benchmark for site evidence. First, define the process boundary and target measures, then begin collecting consistent records from relevant systems or instruments. Document data gaps, units, operating conditions, and any assumptions. If historical records are incomplete, treat early estimates as provisional and establish a reliable measurement process before claiming realized savings. Compare post-deployment results only when the baseline and current data are sufficiently comparable.
What is the difference between automation ROI and payback period?
ROI expresses the return relative to investment as a percentage for a stated period: net benefits divided by total investment, multiplied by 100. Payback period estimates how long it takes for cumulative net benefits to recover the initial investment. ROI describes a return over a defined timeframe; payback describes time to recovery. Both depend on consistently scoped costs and benefits, and neither should present projections as measured results.
How can energy monitoring help verify automation savings?
Energy monitoring can provide consumption records for the process or assets included in the business case. Compare baseline and post-deployment readings using the same boundaries, and account for production output and relevant operating changes. Sub-metering may improve visibility where site conditions and project scope support it. Convert a measured reduction into a financial benefit only when applicable cost records and attribution support the calculation; monitoring alone doesn’t prove automation caused the change.