NET WIZARDS
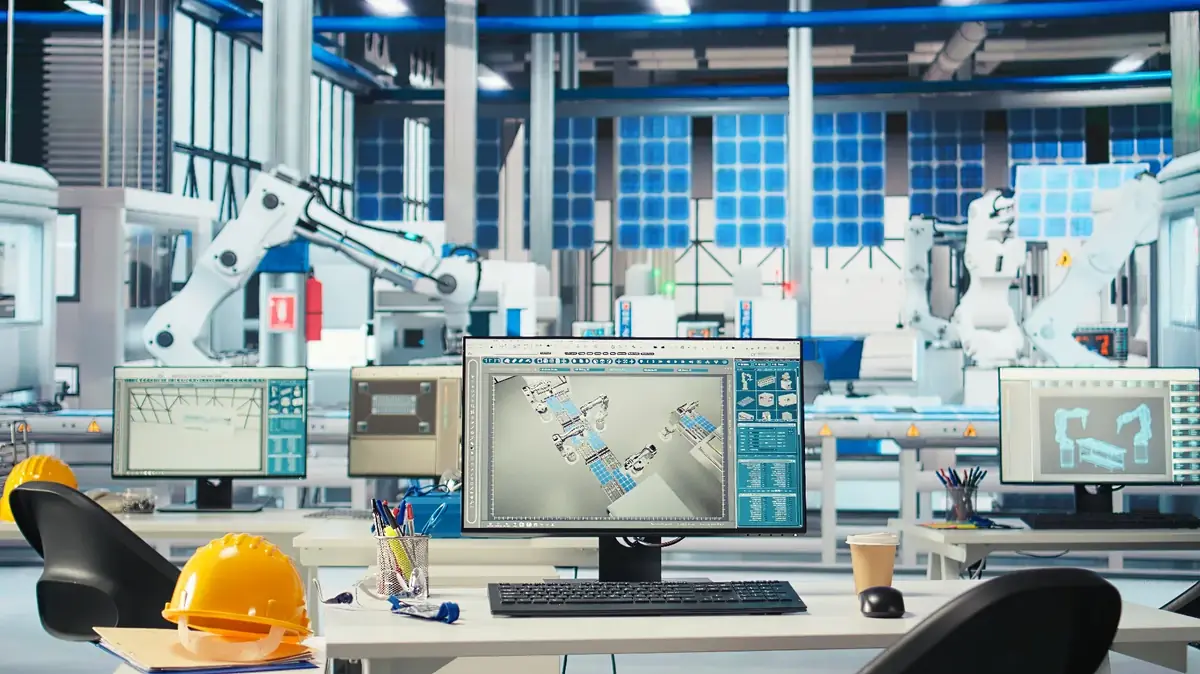
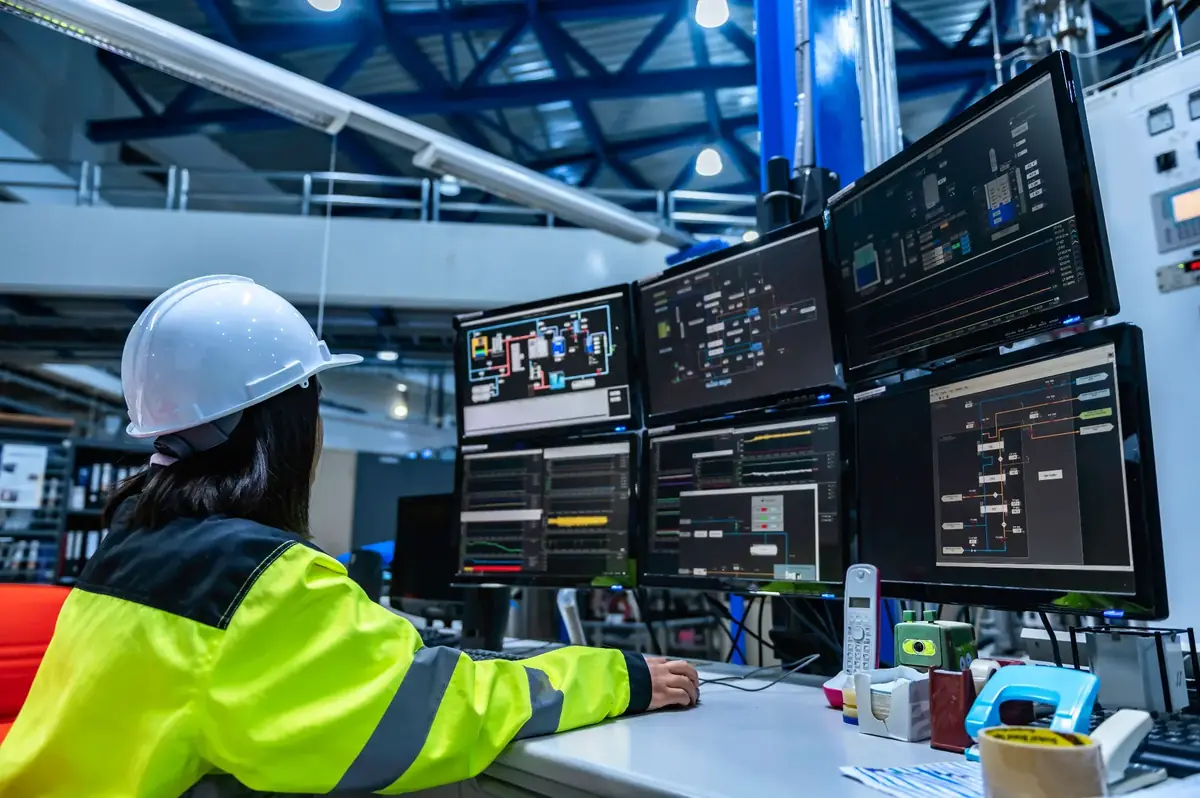
    Manufacturing engineer inspecting connected production equipment on a factory floor

    Manufacturing technology solutions

    Plant floor visibility, AI quality inspection and Industry 4.0 delivery for manufacturers

    NET WIZARDS connects machines, utilities and quality checks on the production floor into one operational layer, so plants across the UAE and GCC can see losses as they happen instead of reconstructing them at the end of a shift.

    What Manufacturing operators gain

    Losses visible while the shift runs

    Availability, performance and quality losses are recorded by machine and reason code, so the morning meeting works from the same numbers as the line.

    Quality checked on every unit

    Vision models inspect at line speed on edge hardware, which removes sampling gaps and keeps a defect image trail for traceability.

    Maintenance planned on condition

    Vibration, current, temperature and cycle counts show how equipment is degrading, so interventions are scheduled rather than forced.

    Energy tied to production

    Electricity, compressed air, water and gas are metered per area and compared against output, which exposes consumption that produces nothing.

    Industry overview

    Manufacturing & Production in the UAE and the wider GCC

    Manufacturers across the MENA region are under increasing pressure to improve productivity, reduce downtime, and achieve higher levels of operational excellence. Achieving this requires real‑time visibility into machines, processes, and workforce performance , all while maintaining strict quality and safety standards. NET WIZARDS enables this transformation by integrating plant‑floor data, AI‑powered analytics, and rugged industrial networking into a unified digital ecosystem that enhances OEE and accelerates Industry 4.0 adoption. By combining computer vision, edge computing, MES integration, and long‑range industrial connectivity, we help factories digitize their operations end‑to‑end. From automated quality inspection to predictive maintenance and energy optimization, our solutions empower manufacturers to make faster decisions, eliminate inefficiencies, and scale digital capabilities across multiple production lines and facilities.

    Where plant floor data usually breaks down

    • Machines from different vendors and generations expose data through incompatible protocols, or none at all.
    • Downtime and reject reasons are captured on paper and typed into spreadsheets hours later.
    • Manual inspection samples only part of the output, so defects reach the customer before the pattern is noticed.
    • Energy is billed at the site meter, which makes it impossible to attribute cost to a line or a product.
    • Factory environments defeat office grade networking, which makes data collection unreliable.

    Capabilities

    Engineering capabilities for production environments

    Hardware, edge software and platform services are specified, integrated and supported by NET WIZARDS as one system, sized for the plant rather than for a demonstration.

    Machine and line connectivity

    PLCs, drives, controllers and standalone machines are read through native protocols or retrofitted sensors where no data port exists.

    OEE and downtime analytics

    Availability, performance and quality are calculated per machine and shift, with downtime events captured automatically and reason coded by operators.

    Computer vision quality

    Edge deployed models inspect surface defects, assembly completeness, label and print accuracy and packaging integrity at line speed.

    Predictive maintenance

    Vibration, motor current, temperature and cycle data build a condition history per asset that maintenance planning can act on.

    Energy and utility monitoring

    Sub metering for electricity, compressed air, water and gas by area, line and major consumer, normalised against production volume.

    Industrial networking

    Managed industrial switches, wireless bridges and segmented networks engineered for interference, vibration and temperature on the shop floor.

    Solution architecture diagram

    How connected manufacturing works, from sensor to cloud platform

    Machine signals, quality images and utility readings are collected where they are produced, processed on edge hardware inside the plant, then published to the platform for reporting and integration with MES and ERP systems.

    01

    On the production floor

    Field devices and placement

    PLC and machine data

    State, counts, cycle time, faults and recipe in use

    Placement
    Machine control cabinets across each line
    Power
    Panel supply

    Inspection cameras

    Surface defects, assembly completeness, label and print accuracy

    Placement
    Fixed mounts at inspection points on the line
    Power
    Mains with power over Ethernet

    Condition sensors

    Vibration, motor current, temperature and run hours

    Placement
    Motors, gearboxes, pumps, fans and compressors
    Power
    Battery or mains

    Utility sub meters

    Electricity, compressed air, water and gas consumption

    Placement
    Distribution boards, headers and major consumers
    Power
    Mains with current transformers
    02

    Wireless connectivity

    Low power wide area network

    Industrial Ethernet, plant wireless or long range wireless

    Fixed machines use wired industrial Ethernet where cable routes exist. Retrofitted sensors in hard to cable areas use plant wireless or long range wireless, decided by survey.

    Gateways and network server

    Edge gateways and fanless edge computers normalise protocols, timestamp events, run vision and anomaly models locally and buffer data so a network interruption never loses a shift record.

    03

    Cloud platform

    Storage, rules and reporting

    Platform services

    Device management, secure ingestion, time series storage, rules and alerting, role based access and open interfaces for integration with the systems already in use.

    • OEE, downtime and reject reporting by machine, line and shift
    • Defect images and inspection results linked to batch and time
    • Condition trends and maintenance alerts per asset
    • Energy intensity per unit produced, by area and product
    • Open interfaces to MES, ERP and quality management systems
    04

    Who acts on the data

    Operations and reporting

    Production and shift leaders

    Live line status, current losses and reason codes on floor displays and dashboards.

    Maintenance and engineering

    Condition history and fault patterns that turn breakdown response into planned work.

    Plant and group management

    Comparable performance, quality and energy reporting across lines, plants and shifts.

    Architecture shown in schematic form. Machine lists, tag mapping, camera positions, lighting and network routes are specified per plant during the design stage.

    Focus areas

    Where Manufacturing programmes usually start

    Industry 4.0 Shop Floor for manufacturing & production operations
    01

    Industry 4.0 Shop Floor

    Modern shop floors demand real‑time insights into machine performance, production flow, and energy consumption. NET WIZARDS delivers Industry 4.0‑ready solutions that integrate MES, OEE dashboards, predictive maintenance engines, and energy monitoring into a single operational layer. Our systems connect directly to PLCs, sensors, and industrial controllers through rugged, interference‑resistant networking designed for harsh factory environments. With unified visibility across machines and processes, manufacturers can identify bottlenecks, reduce downtime, and optimize production cycles. Predictive analytics and automated alerts help maintenance teams act before failures occur, while energy dashboards highlight inefficiencies that drive unnecessary costs. The result is a smarter, more resilient shop floor built for continuous improvement.
    Computer Vision Quality for manufacturing & production operations
    02

    Computer Vision Quality

    Quality inspection is one of the most labour‑intensive and error‑prone processes in manufacturing. NET WIZARDS deploys production‑ready computer vision systems powered by more than 20 specialised AI models for defect detection, PPE compliance, assembly verification, and process monitoring. These models run on edge devices directly on the production line, ensuring instant detection without relying on cloud latency. Our vision systems integrate seamlessly with MES, SCADA, and quality‑management workflows, enabling automated rejection, traceability, and real‑time reporting. By eliminating manual inspection errors and ensuring consistent quality at scale, manufacturers achieve higher throughput, reduced scrap rates, and stronger compliance with industry standards, all while maintaining a safer, more controlled production environment.

    Technical deployment

    Built around the machines you already run

    Results depend on the equipment, the product mix and the network. We document what will be read, how it will be read and what acceptance looks like before installation starts.

    Protocols and machine access

    Modbus RTU and TCP, OPC-UA, EtherNet/IP, PROFINET, MQTT with Sparkplug B and digital inputs, with retrofit sensors where a machine exposes nothing.

    Edge and vision hardware

    DIN rail gateways and fanless edge computers sized per area, with industrial cameras, lens selection and controlled lighting for each inspection point.

    MES and ERP integration

    Production orders, batch identifiers and quality results exchanged through documented interfaces so shop floor data lands in the systems already used to run the business.

    Network and security design

    Segmented plant networks, controlled outbound connections, encrypted transport and role based access, so monitoring never becomes a route into control.

    Delivery path

    How a Manufacturing programme is delivered

    01

    Assess

    Our engineers survey the assets, control systems, network paths and reporting needs on site, then agree which data carries real operational value.

    02

    Design

    Device lists, placement drawings, protocol mapping, radio planning, security boundaries and platform structure are documented before anything is ordered.

    03

    Pilot

    One area, line or asset group is instrumented and validated against acceptance criteria agreed with your team in advance.

    04

    Scale

    The validated pattern is repeated across the remaining assets and sites, with configuration and device management handled centrally.

    05

    Operate

    Dashboards, alerts and reports are handed over to your teams with training, remote diagnostics, tuning and a documented escalation path.

    Reference figures from delivered work

    +18%
    Average OEE improvement
    -40%
    Quality defects via vision
    20+
    Production-ready vision use cases

    Figures are indicative of past deployments. Results for your sites depend on the assets, connectivity and processes recorded during the engineering assessment.

    Frequently asked questions

    Our machines are old and have no network port. Can they be monitored?
    Yes. Where a machine exposes no data, we retrofit sensors for state, counts, current, vibration or temperature and derive the same performance metrics from those signals. Many plants run a mix of native protocol reads and retrofitted sensing.
    Does computer vision inspection run in the cloud?
    Inspection runs on edge hardware at the line, so the decision is made in milliseconds and does not depend on the wide area network. Results and defect images are published to the platform for reporting and traceability.
    Will the system interfere with production control?
    No. The data layer reads from controllers and sensors and does not take control of the process. Where an automated reject action is required, it is implemented by the machine builder or integrator within the existing control system.
    How is OEE calculated and validated?
    Availability, performance and quality are calculated from machine states, counts and cycle times, with reason codes captured by operators. During the pilot the calculation is validated against your own records before it is used for reporting.
    Can several plants be reported together?
    Yes. Each site is instrumented with the same pattern and reported in one platform, with role based access so a plant sees its own detail and group management sees comparable performance across sites.

    Related solutions and industries

    Manufacturing programmes draw on our Industry 4.0 architecture, the Industrial Cloud platform and AI video analytics, using industrial gateways, edge computers and networking hardware from our product range.

    Explore our solution portfolio, product range and the other industries we serve.

    Discuss your Manufacturing project

    Tell us about your sites, assets and reporting needs. Our engineers will respond within one business day.